Dynamic Dashboard 📈
Tired of spending hours poring over data and trying to create visualizations that accurately represent your findings? Our AI-powered data visualization tool uses a single-line prompt to create stunning charts and diagrams that accurately represent your data in an easily digestible format.



User-Interface
Representation
Attractive
Charts

Improved Decision-Making
By providing accurate insights and visualizations in a fraction of the time it would take to create them manually, this AI-powered data visualization tool can help you make better, more informed decisions. With real-time data at your fingertips, you can respond more quickly to changing market conditions and stay ahead of the competition.
Data-Driven Strategy
Dynamic Dashboard’s AI-powered data visualization provides a clear and concise way to understand your data, allowing you to develop data-driven strategies that align with your business goals. With accurate insights and customizable charts, you can identify opportunities for growth and optimize your business processes.


Increased Collaboration
Dynamic Dashboard’s user-friendly interface and customizable charts allow for increased collaboration across teams and departments. With easy-to-understand visualizations, you can communicate complex data insights to stakeholders, encourage cross-functional collaboration, and drive business results.
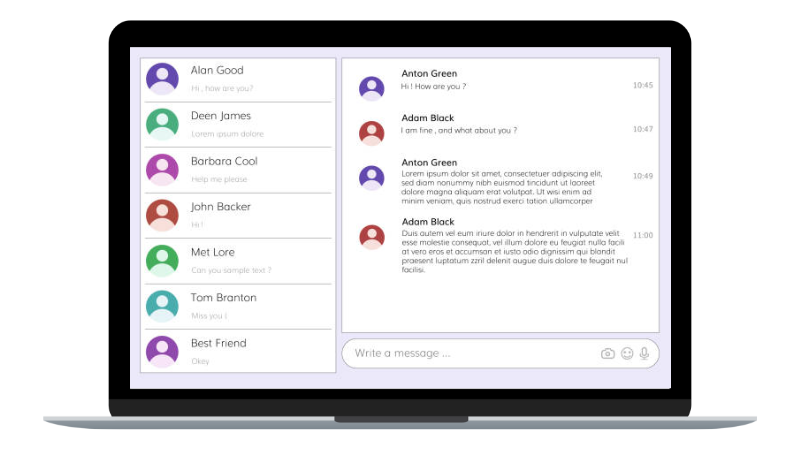
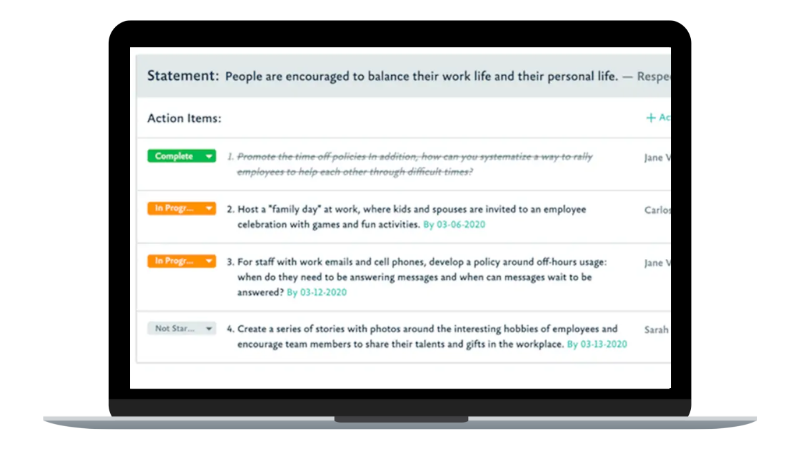
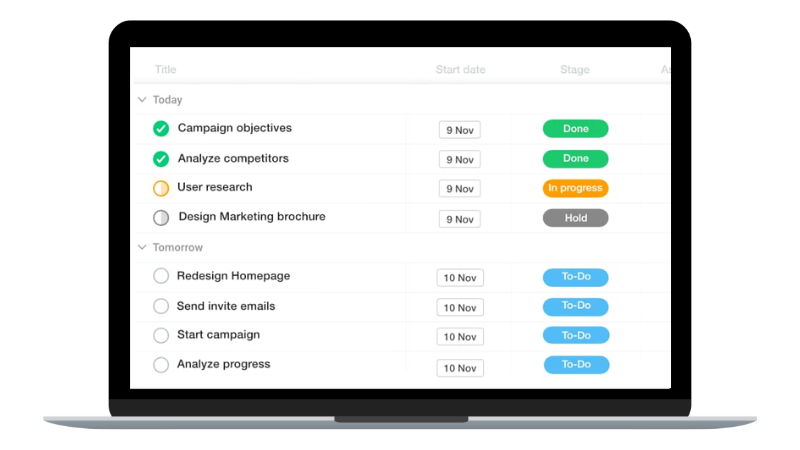
Here's What It May Look Like For You
Say goodbye to hours of manual data analysis and hello to faster, more
effective decision-making via AI-powered data visualization.
Save Your Business From Losing Another Customer!
Please fill the complete form with required information.
Someone from our team with shortly contact you to to begin the setup process.

Here's What Our Delighted Clients Have To Say About Us
These clients are glad they chose us - and so will you!
SparkLab was extremely helpful in providing us with the AI solutions we needed at WorkHub. Their team was very responsive and provided us with great results. Overall, we are extremely happy with the services that SparkLab provided us. We highly recommend them to our partners and really look forward to working with them again.

Qudsia Piracha
Product Manager
SparkLab was very helpful in getting our company set up with the AI solutions we needed. They were able to quickly understand our business and what we needed help with at eKomi. They were also very responsive and helped us get everything set up quickly. Overall, we're very happy with the service SparkLab provided and would recommend them to others.

Michael Ambros
Founder & CEO
Signup to the free SparkLab's AI updates


